
![]()
Whether you use A10, f5 or some other load balancer, you’re probably used to the idea of health monitors, or “health checks”. The load balancer periodically performs some kind of connectivity test to the servers that are used to service a given VIP (virtual IP), then if a certain number of health checks are unsuccessful, the service on that particular server is marked unavailable and it is no longer used to service requests to that VIP.
Sounds simple enough, but things are rarely straightforward – and this is no exception.
Hellos and Dead Timers
Using regular tests and counting failures is pretty typical network protocol behavior. For example, by default HSRP sends out Hello packets every 3 seconds. If the HSRP neighbor does not see a Hello packet within 10 seconds (i.e. 3 have been missed) it assumes the neighbor is down. OSPF works in a similar fashion, as do EIGRP, IS-IS, BGP and more.
Rather than defining a Dead Time (10 seconds in the example above), load balancers seem to simply define how many health checks in a row must fail before a device is marked down. In A10 lingo you define Interval (gap between each health check) and Retry (number of failure) values.
Timeout
There’s one more parameter that’s important to a load balancer. Because load balancer health checks invoke two-way communication (more complex than just a stateless hello packet), it’s important to define a Timeout parameter to say how long you should wait for a valid response. If your health check is an HTTP GET, you might want to wait up to 2 seconds to see an HTTP response. If the server is responding, but responding slowly, you probably want to consider marking it as unavailable anyway as a slow response is most likely a sign of a server in trouble. So by setting Interval, Retry and Timeout values we allow the load balancer to determine when a server should be considered unavailable to service requests.
Doing the Math
Based on the above, let’s see how long it takes for a server to be marked down when health checks fail.
| Parameter | Value |
|---|---|
| Interval | 5s |
| Retry | 3 |
| Timeout | 2s |
Scenario 1 – Apache Daemon Dies
A server daemon crashed (let’s say it’s Apache). How long until it is marked down?
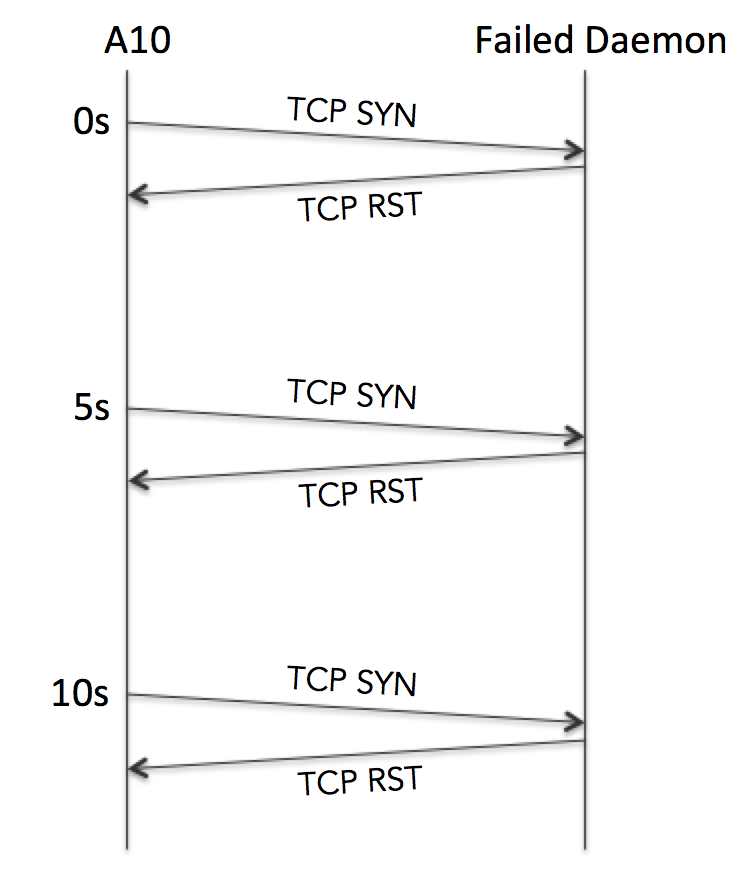
Because the server is up but the service has died, the server OS returns a TCP RST when the health check is received. The A10 immediately notes this failure in the logs:
![]() However, as predicted above it waits until it has received an additional two failures before marking the service down in the logs:
However, as predicted above it waits until it has received an additional two failures before marking the service down in the logs:
![]() In total then, we’re looking at roughly a 10 second delay (in reality usually about 11 seconds by the time it has been processed and logged). Some more basic math might suggest that the calculation should be Interval x Retry = 15s; that’s absolutely valid if the daemon died just after the last healthcheck. So on that basis perhaps I should revise the answer to be “11–16 seconds”?
In total then, we’re looking at roughly a 10 second delay (in reality usually about 11 seconds by the time it has been processed and logged). Some more basic math might suggest that the calculation should be Interval x Retry = 15s; that’s absolutely valid if the daemon died just after the last healthcheck. So on that basis perhaps I should revise the answer to be “11–16 seconds”?
Result: 11–16s
Scenario 2 – Server Dies
In the event that a server dies, there will be no RST sent by the server. However the behavior will be exactly the same as before, with an 11–16 second window for the service to be marked down.
Result: 11–16s
Scenario 3 – Apache Responds Slowly
What happens when the A10 can connect to the apache server (that is, TCP establishes a connection) but the web server is slow to deliver responses? This is where the Timeout value comes in. What we see in a packet capture is effectively this:
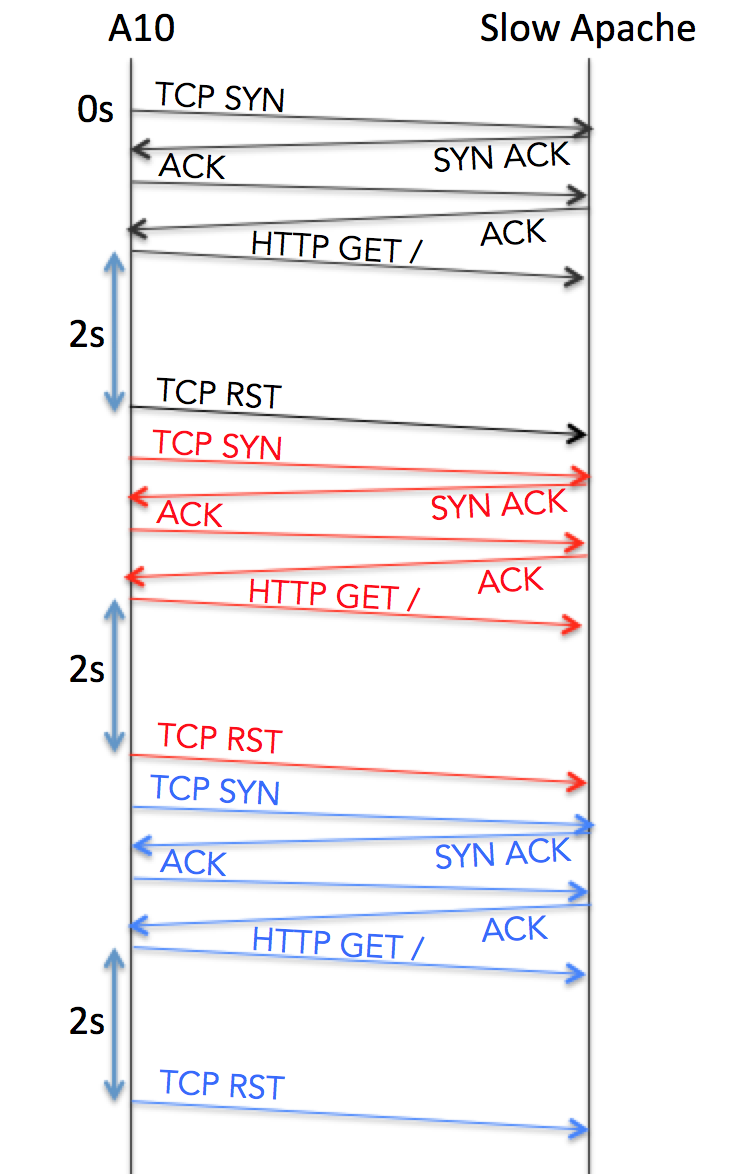 If a connection is established but the service does not respond as expected within Timeout seconds, the A10 sends a TCP RST to kill the connection then immediately makes another attempt. This process repeats until Retry connections have failed in the same way, at which point the service is marked down. Time wise, this means that the service failure is detected within 4 seconds of the first failure. Add in up to 5 seconds for the Interval period, and we’re looking at 4–9 seconds.
Result: 4 – 9 seconds.
Scenario 4 – Apache Returns 500 Error
This scenario is more interesting, and the answer is not 11–16 seconds. The moment the A10 receives an HTTP error (e.g. a 500 error), it immediately marks the service down. In this instance, the retries do not come into the picture. A worst case would be that if a service started generating 500 errors immediately after a health check, you might have to wait 5 seconds until the next polling cycle.
Note: You can override this “Immediate failure” behavior of HTTP health checks by selecting the “Strict Retry” option in the Health Check configuration. This forces the A10 to wait until it has received Retry HTTP errors before it marks the service as down.
Result: Immediate (up to 5s)
Those Three Behaviors
Based on a quick poll – including myself – not everybody is aware of all these behaviors. We tend to think that because we configured the Interval and Retry values, that’s presumably going to be the case every time; not so. The A10 displays at least three behaviors which I have lab validated and given my own names to:
| Name | Description |
|---|---|
| Standard Failure | 11–16s to mark a failed service down |
| Accelerated Failure | 4–9s to mark a slow-responding service down |
| Immediate Failure | 0–5s to mark an HTTP server with 500 errors as down |
Did you know about these?
Technical Notes
In case you’re interested, I performed lab validation on my laptop using:
- vThunder (A10 running on VMWare)
- tcpdump on OSX, monitoring the Mac’s vmnet0 IP
- a perl script that acted like a web server and listened on the Mac’s vmnet0 interface
I coded the web server to simulate slow response and 500 errors as needed, and used a really simple “ifconfig vmnet0 down” in OSX to simulate total host failure.
30 Blogs in 30 Days
This post is part of my participation in Etherealmind’s 30 Blogs in 30 Days challenge.
Leave a Reply