 I have a T-shirt from the nice folks at NetBeez, and on the back it says “Ask me about my Beez!” Naturally people can’t resist asking and I’ll happily explain, but on the off chance that you’re not lucky enough to be standing behind me I’m going to share my thoughts on NetBeez and the product sample they were kind enough to let me play with.
NetBeez at NFD9
I met NetBeez at Networking Field Day 9 where they presented their distributed monitoring solution. I’m not going to repeat what they said for the most part, so if you have time, it’s worth watching their full presentations from the NetBeez page at Tech Field Day.
The high level overview of the NetBeez solution is that they offer small, cheap, plug-and-play network agents that you can put on your network, from where they will perform connectivity and performance tests and report back to a central dashboard which can generate reports, statistics and alerts. The agents are designed to be cheap enough that you could put one on every remote site and monitor, say, access to a critical corporate server and find out quickly which remote sites are seeing performance issues, preferably before somebody on site calls to tell you. This kind of distributed monitoring is not entirely new – I can see analogies with the monitoring that systems like ThousandEyes and KeyNote perform – but NetBeez seem to bring a level of simplicity and low cost to this process that is unusually pleasant.
Hardware and Installation
The NetBeez agent I was given is a Raspberry Pi in a black box with a NetBeez sticker on it. I actually respect that; this is effectively a white (black) box server that happens to be incredibly cost-efficient. Power is provided by a wall wart with a USB socket but since it’s a Raspberry Pi you can run it off almost any USB port. I have confirmed this by unwittingly mirroring Lindsey Hill, and have powered my agent from the USB port on a Juniper SRX. I forget who recently referred to the USB ports on Cisco devices as an “iPhone Charging Port,” but there’s some truth to that idea it seems.
The basic installation process for the NetBeez agent is as follows:
- Plug in the network cable
- Plug in the power cable
- Go to the cloud-based dashboard and name the new agent. Static IP configuration can be performed from the dashboard, but since for me the IP doesn’t matter, I’ve left it running DHCP.
The agent is now online and monitored from the dashboard, and can be configured to start running tests.
NetBeez Web Dashboard
The NetBeez web dashboard is simple, though it took my head a few minutes to get smart about what some of the terminology meant.
Agents
The Agents tab shows all the NetBeez agents available within the account. IN this case, I have named my agent “Agent Herbert”:
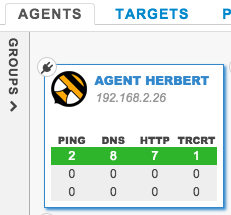
The image also shows that my agent is configured to run 2 ping tests, 8 DNS tests, 7 HTTP tests and 1 traceroute test and reporting back on those results from the perspective of my home network.
Targets and Test Sets
A Target is not the target for a test. Or rather, it is, but not the way you might think. The icons showing in the Targets tab represent sets of tests, not individual tests:

Each of these items could be set up for convenience based on your needs. For example we might set up what I will call “test sets” like:
- Critical Corporate Apps
- Internet Access
- VPN Response
Each test set can be deployed to any agent(s) you want, so the VPN Response test set would only be used for agents on sites using VPN access, every agent would run the Critical Corporate Apps test set, and so on. What’s in a test set?
The Real Targets
The test sets can contain any desired group of targets (tests), each of which is of a particular type and has specific destinations and test criteria defined.
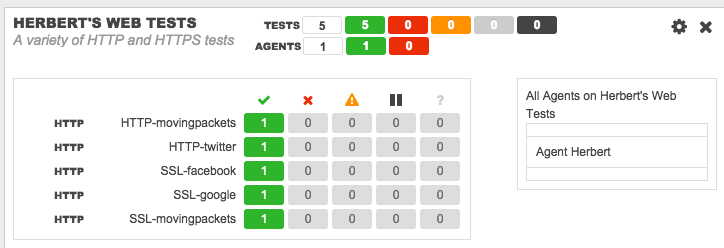
The summary of the “Herbert’s Web Tests” test set shows that I have five HTTP tests configured (though they can also be HTTPS), and that they are being run only on Agent Herbert at the moment. Choosing to “Edit Target” (which really means “Edit Test Set”) reveals more information about each target making up the test set:
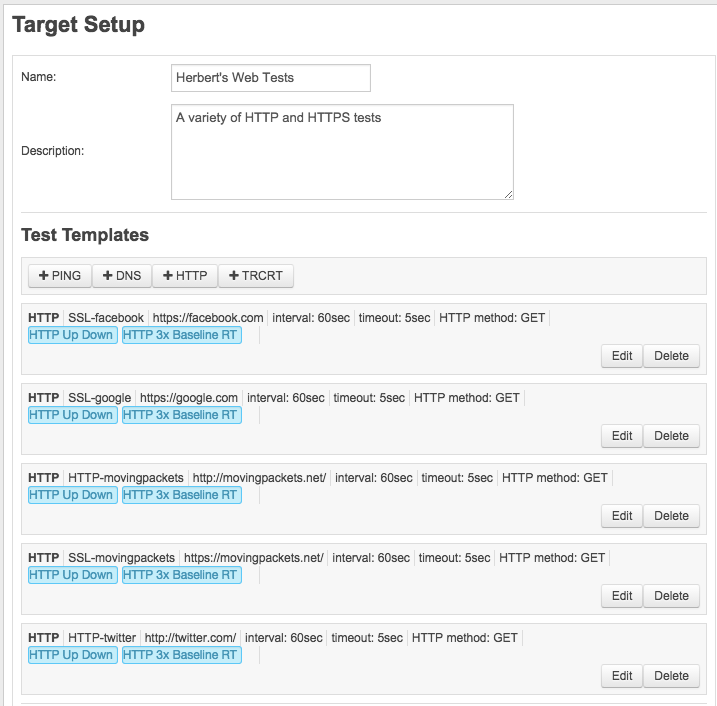
To dig even further, each target (test) can be edited:
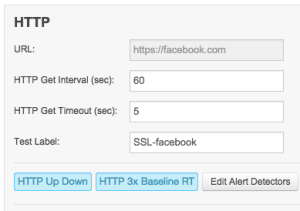
When you save the test set, the updated definitions are pushed out to all the agents configured to run that set.
Traceroute Target
A special mention is in order for the traceroute test. Not only can the historical hop by hop results for each poll be viewed, but the number of hops is monitored as a performance parameter and can therefore help you identify when a major path change has taken place:
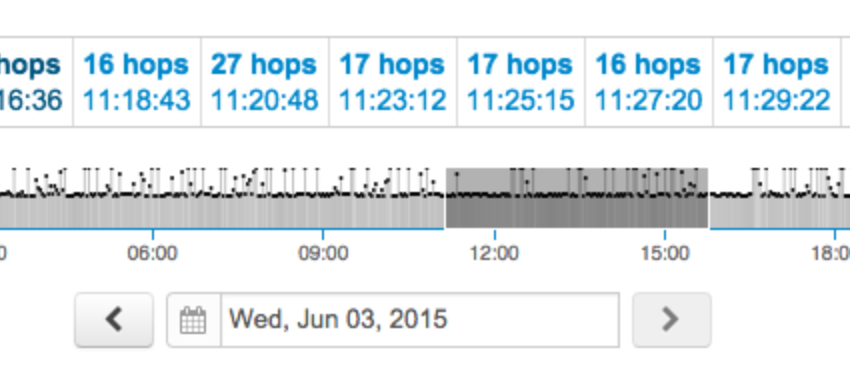
Knowing your network baseline is critical to understanding exceptions, and I had a case just a few months back where having this traceroute information to hand would have helped confirm a diagnosis from a site where we otherwise had no access to perform troubleshooting. The ability to wind back the clock and know that before a problem occurred the path was X and during the problem period it was Y is very useful. Since the path taken is dependent on the direction of flow, the ability to see the flow of packets from a remote site back to a service, rather than the other way around, is essential, and missing from many network monitoring solutions.
Reporting
Basic reporting is offered for each protocol in the form of a heat chart; a matrix of agents against tests:
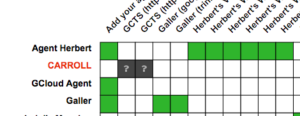
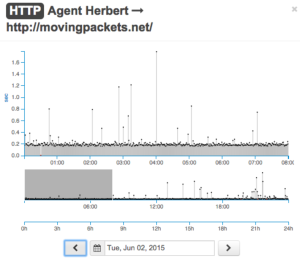
Any colored square can be clicked on to bring up a mini chart which updates in real time with a very cute animation (the vertical lines are drawn in almost hypnotically) which leads with one more click to a historical data chart:
Other reports can be generated by selecting test sets and a date range. Results are plotted showing percentage of success, failure and alerts (which means successful but out of the usual range).
Other Agent Types
I have a FastEthernet Raspberry Pi as my agent, but looking at the NetBeez web site, there is also a GigabitEthernet Beez, a wireless Beez, a VM Beez and an External Beez (for AWS and Google Compute Engine), which should suit many environments. In my head I want each agent to be a “Bee” so that the plural is Beez; I am not in luck.
Wish List
Here are a few things I’d ideally like to see this product, some of which I have suggested to NetBeez. This is a good moment to mention that the response time on comments and feedback has been incredible; responses are often within minutes of submitting a comment. Maybe special attention is paid to the NFD9 delegates, but even so that’s impressive.
TCP Tests
I work too much with load balancers these days and bury my head in the world of health monitors, and I keep thinking that there are two test types that deserve to be in the product sooner or later:
- TCP Monitoring. Not everything is HTTP, and it’d be nice to be able to monitor any arbitrary TCP port with a 3-way handshake, not least because that’s likely to get through firewall rules where ICMP may not, so I can also measure response time that way.
- Send Strings / Expect. I think there’s value in being able to connect, send strings (both in HTTP and in TCP streams) and look for a given response, then raise an exception when you get an unexpected response. Sounds stupid? How about for DNS. It’s all very well testing that I can resolve an address for a given server, but if the answer is incorrect it’s not so good (think of how BIND views might affect resolution from different locations).
Terminology
My head spins with Targets and, uh, Targets. How about Test Sets and Tests? Target Sets and Targets? This baffled me when I first tried the dashboard, then I took a break, now coming back to the dashboard it baffled me all over again and took me an inordinate amount of time to figure out how to add a test again.
Retina Graphics?
Maybe it’s just me, but the graphics and the text seem, well, slightly fuzzy on my MacBook Pro with Retina screen. It makes my eyes hurt like they can never quite get things in focus. I don’t know if this is just graphics being stretched to fit, something Safari is doing, or something else, but the clearer it can be, the happier I am.
Update 6/4/2015: I apologize to NetBeez and withdraw the comment about the graphics! I realized today that I was viewing the website on an attached non-retina monitor, and it’s that monitor that was responsible for the fuzziness. This was entirely user error. Sorry in particular to Allison who is responsible for the UI/UX at NetBeez, who I’m sure had a moment of panic, because in fact on the built-in retina screen the graphics are beautifully crisp. Pure PEBCAK on this one, and I am ordering some humble pie for dessert.
Development
NetBeez presented at NFD9 back in February, and I’m sure things have moved on since then. I am not privy to their roadmap, but talking briefly to Panos Vouzis it’s clear that the company has considered many of the things that are on my mind, and he mentioned a couple of things that go way beyond (in a good way) the capabilities that I had considered for the product.
When NetBeez was presented to us, I believe the account limit was for 200 agents. That’s certainly enough for many companies, but may be a limiting factor for some.
My 2 Bits
NetBeez offers a neat solution, and the use of low cost agents makes for an appealing solution for monitoring a number of remote sites, and the cloud-based monitoring and dashboard makes deployment simple and fast. I believe that distributed monitoring is on more people’s radar now, especially with the prevalence of debatably reliable WAN solutions in place. If you’re looking in this direction, NetBeez would be a great company to include in your research.
Disclosures
NetBeez paid to present at Networking Field Day, and that money in turn paid for my transport, hotel and food/drink while I was at the event. I receive no payment to attend the event, and am under no obligation to tweet, blog or otherwise publicize the vendors or their products. Please read my full disclosure statement for more details.

Leave a Reply