 If you’re used to configuring f5 LTM load balancers, you’re probably used to the idea that you normally set two health checks for each VIP you have. The first is at the node level, often just an ICMP ping, which checks that the host itself is up. If that health check fails and node is deemed to be down, it is implied that any ports currently reference on that same host should be marked as down immediately. Similarly there’s a service-level health check where you’d check the actual service you’re load balancing to – e.g. an HTTP get, or a TCP check, DNS test, or other custom check to make sure that the server is responding properly.
When you configure an A10 it feels like you have the same, but actually there’s one that many people don’t even notice.
Server Port Health Monitor
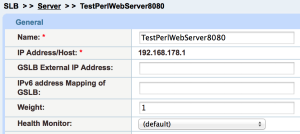
I call the overlooked check the “Server Port” health monitor. It exists on the Server page but unless you’re looking carefully, it’s easy to miss. On the A10 when you add a server, you define a server-level health monitor (e.g. ICMP ping) just as you do with f5:
 You then state which ports on the server you will be using, and add them at the bottom:
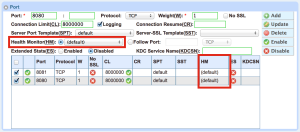 Typically, you’ll just type the port number and hit Add. However, I’ve highlighted the Health Monitor setting on the image above, and you can see that each port can have its own unique health monitor defined.
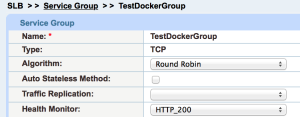
Finally, you go to the Service Group settings and add a health monitor at the service level, again like f5:
 The default Server Port Health Monitor is a TCP connection; it’s a full handshake and connection teardown. What this means is that every 5 seconds or so, the server sees three health checks:
- ICMP Ping (Server level)
- TCP (Server Port level)
- HTTP (Service Group level)
In fact, since I defined the Server above to have two open ports (8080 and 8081), and added both of those to that Service Group as well, I’ll actually see five health checks:
- ICMP Ping (Server level)
- TCP 8080 (Server Port level)
- TCP 8081 (Server Port level)
- HTTP 8080 (Service Group level)
- HTTP 8081 (Service Group level)
This isn’t a disaster by the way, but when you’re looking at tcpdump output it’s very confusing to note that you’re seeing more health checks that you thought you had actually configured.
Why Server Ports?
There’s probably more to it than I’ve seen so far, but to me the best thing about defining Server Ports is that you now have an object that represents the service on a particular server but can be controlled independently of either the server-level status or any Service Groups to which it’s tied. If you disable the Server Port on the Server properties, it will be marked down on all the Service Groups that reference it. Kind of handy if you need to do a service upgrade, for example, on a single daemon.
Why not just use health checks? Because (just like with the “Retry” parameter) a service might be up, but might not be ready or stable enough to take traffic. Controlling it at the Server Port level means you can very accurately take a specific port in and out of service on a given server in one place, and with supreme ease. Do it like this:
Do We Need Server Port Health Checks?
This is where I’m struggling. Maybe there’s a good use for them, but the Service Group will perform health checks anyway, so it seems a little redundant. Perhaps what you might be able to do, if you have a server port that is reference by many Service Groups, would be to have a more complex health check running at the Server Port level, and then run a faster and lower-load health check on all of the Service Groups. That way you’d only see one complex health check every 5 seconds, in additional to n*simple_checks.
Actually, I may have just convinced myself of their use.
What if I Don’t Want Them?
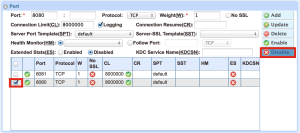
You don’t have to have Server Port Health Monitors. To have none, select an item to edit it, then in the Health Monitor box, choose, uh, the blank bit. I’d prefer it to say “No Monitor” but it currently just shows a blank instead:
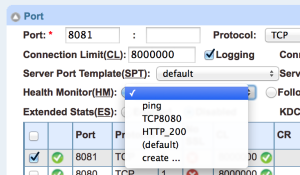 Then click Update. My experience says that it’s worth refreshing the page to make sure that your change actually took, by the way – there are some oddities about updating health monitors that I have not quite figured out, but I did find that my changes did not take every time. Probably user error, mind you!
Conclusions
There you have it. A10 has tweaked up what we’ve been used to on other platforms, and in the process given those of us used to the f5 world a health monitor we wouldn’t have even thought to look for; and now know you too!
30 Blogs in 30 Days
This post is part of my participation in Etherealmind’s 30 Blogs in 30 Days challenge.


Hey John, great post.
The additional Server Port checks almost seem like port knocking for monitors.
I was wondering what the options where if say, the 8081 monitor failed but the 8080 passed. Can you specify that all (or conversely, only one or some) must pass for the service to stay UP?
Cheers
Steven: That can be done using compound monitor .. either using an OR and AND Operator..
EWhen using below both the HMs should be passed for the service to be UP.
EX:
health monitor PRODHM interval 60
method compound sub TEST1-HM sub TEST2-HM and