
Many of us will have experienced the challenges of taking a performance alert (or user complaint) and drilling down to root cause. Performance issues can be intermittent, and it can be difficult to get visibility of what caused a problem at a particular time. Viavi Enterprise thinks it has the answer, combining analysis of packet feeds (e.g. from taps and mirror ports) and IPFix, xFlow and cloud service flow logs to monitor application performance as it would be experienced by a user. Sounds good? It looked pretty good, too.
Johnny Five Need Input!
Nothing can happen without data, and that comes from a number of potential sources.
Observer Gigastor
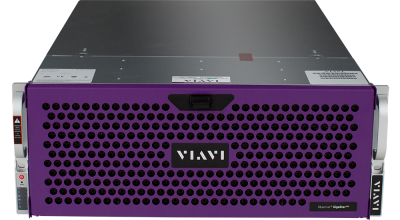
The Observer Gigastor product is available as a virtualized solution (to capture east-west traffic in virtualized environments), a portable appliance for tactical deployment, and two hardware appliance models (in a charming shade of purple) which can provide from 96TB to 1.2PB of storage. The idea of Gigastor is to capture packets at line rate and retain the raw packet data in case it’s needed later. The packets are analyzed, and that metadata is fed to the reporting and visualization system, Observer Apex.
Observer GigaFlow
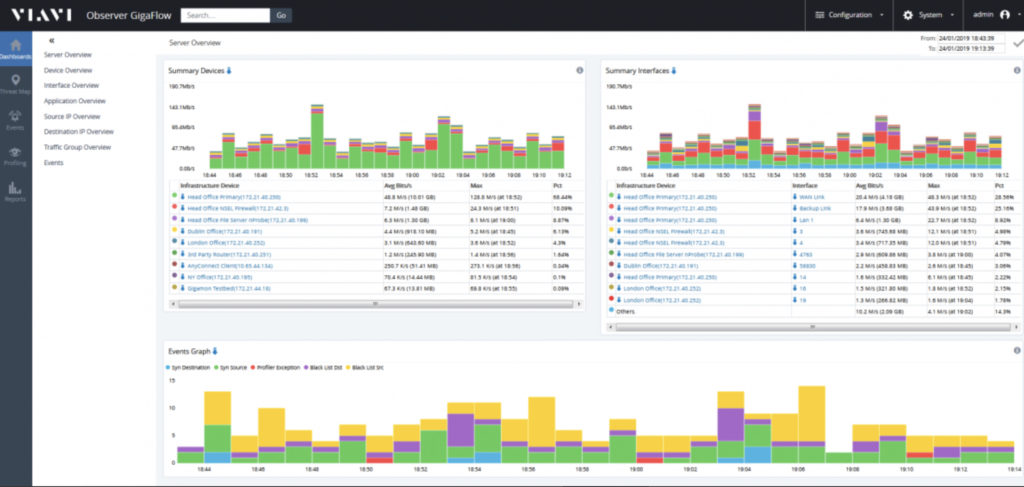
It’s not always possible or practical to tap into a packet flow, so the Observer GigaFlow product, rather than ingesting data packets, ingests flow data from sources like IPFix, Netflow, jFlow, sFlow, cloud provider flow records, and so on. Analysis is performed on these data and the app offers its own interface into the results, but can also feed into the larger picture in Observer Apex.
Observer Apex
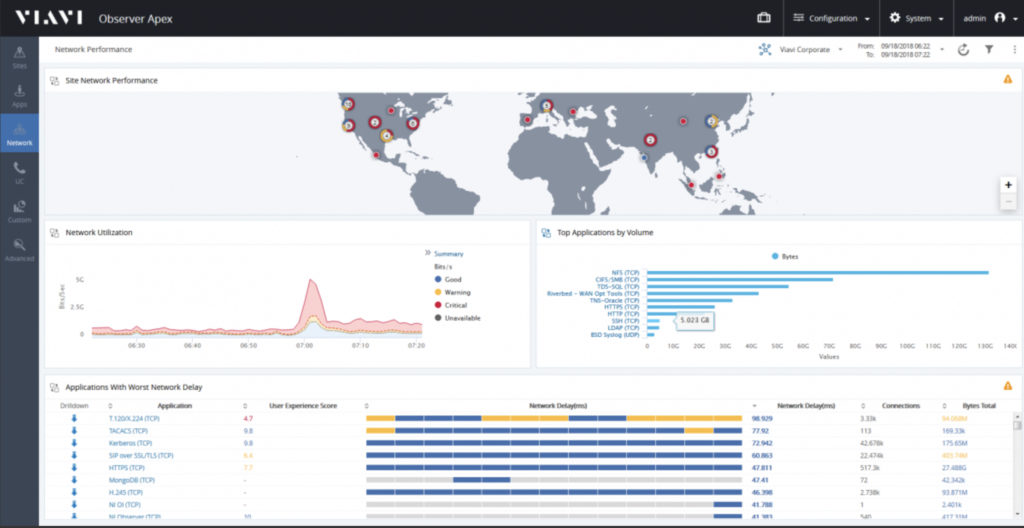
Observer Apex pulls together the packet analysis from Gigastor and the flow analysis from GigaFlow and puts them together into a unified interface. Given the appropriate information, Apex can associate flows to physicals location and it derives a score for each site from 1 (bad) to 10 (excellent) representing the user experience at that site. This score is based on around 200 factors including anomaly detection, which can be customized to some degree, but attempts to represent a wide range of factors which can go into the user experience.
At a high level, looking at a global view, “problem” sites can be easily identified, at which point the user can start to use what I think is one of Apex’s greatest strengths: drill-down.
Drilling Down
Drilling into the site reveals the next level breakdown to show perhaps which application users are seeing a bad response from. Then drilling into the application, all sessions to that app can be seen. Drill down into a single session, and – with help from Gigastor – it’s possible to see a ping-pong diagram of the interactions between client and server, which – assuming the flow is not encrypted – can including the actual decoded commands and responses being exchanged. Want to see that in Wireshark? No problem. The interface is responsive and I can easily imagine spending weeks on end just digging into problems by drilling down to find the source.
The Network Video Recorder
In my opinion, recording and storing every packet flowing through the next is a great idea, but is probably not terribly practical, but the Gigastor appliance makes doing so far more plausible with its 1.2 petabyte storage option. Cunningly though, it’s possible to tell Gigastor which flows to store and analyze versus which should just be analyzed, so it’s possible to gain deep visibility into key flows while still retaining metadata about all interesting flows.
Since Gigastor keeps those stored packets for a defined period of time (subject to any storage limitations), it acts like a network video recorder and, like a VCR, it makes it possible to go back in time and see the actual packets (perhaps the actual queries or commands) being sent when problems were reported, and hopefully identify the nature of the problem. As a network guy, I’d love to be able to wind the clock back and be able to say “actually, the server was showing slow responses to queries at that time, and the network looked fine. Reducing the Mean Time To Innocence is something I wholeheartedly support.
Additionally, keeping copies of the network packets provides a resource for forensics after a security incident, including the ability to track back in time to see, perhaps, when an issue first began (the “patient zero”).
My 2 Bits
I’m excited by the possibilities offered by the Viavi Observer products. I would love to be able to position Observer Gigastor devices at every ingress point to my network and be able to troubleshoot recent issues and retrospectively download packet captures of problem flows. I’d love to see the scores that Apex would assign to each of my sites, and see if they correlate with user reports. In other words, I think I’d like to see this product in my network.
My concerns however, are of scale; not of the product itself, but of my ability to pay for all the Gigastor capture nodes and the GigaFlow analysis appliances that would be required to properly cover my network (even assuming I monitor at choke points). Costs are not on the Viavi website, so perhaps I’m imagining something worse than it is, but just from a hardware perspective, 1.2PB of storage isn’t going to come cheap, if that’s the appliance I chose.
Nonetheless, the potential value to network and security operations here could be huge. I really like the look of this product, and I plan to investigate it further in the future.
Disclosures
Viavi Enterprise presented at the Tech Field Day Extra event at Cisco Live US, 2019. Please see my Disclosures page for more information.
Leave a Reply