Continuing from my previous NetBeez post, I’d like to share some more detail on the charting and reporting capabilities of the product, and my experience using NetBeez to troubleshoot some real network issues.
Incidentally, as advertising slogans go, this one is surprisingly effective; I was surprised at how many people do actually approach and say “Ok go on then, tell me about your beez?”
Hands On Operations
I have been able to spend some time digging around the interface in anger, as it were, and seeing whether the NetBeez tools might raise an alert that otherwise wasn’t caught by other systems. To that end, I have one happy story, but also a number of things I found I wanted to be able to do, but couldn’t. These are things I might not have thought about had I not actually been using them for real, rather than just with test data.
Charts
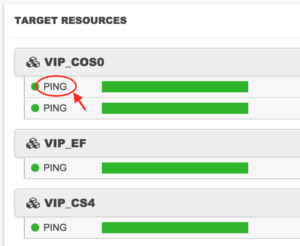
The actual charts are quite nicely put together, although getting there can be a little cumbersome unless linked directly from an alert or something. For example, here is the top of the list of Resources within one of my Target test sets:
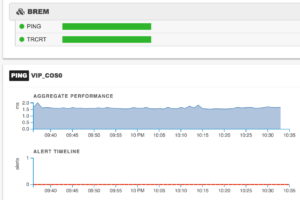
If I click on the PING test on the first Resource (see red arrow above), it highlights in green and seemingly nothing happens. Actually, something did happen, but the activity was at the bottom of the list. Scroll down through all the resources, and below it there’s an graph showing the aggregate performance of all the agents (Beez) running that test, and a chart tracking when alerts were raised:
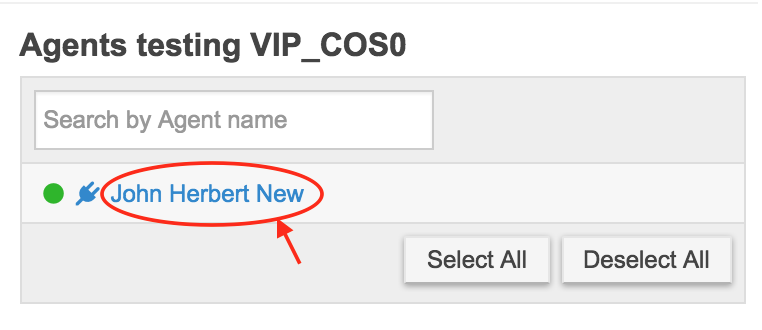
If I want to see just one agent, I look to the right and there is a list of agents. I can now select any one by clicking on it:
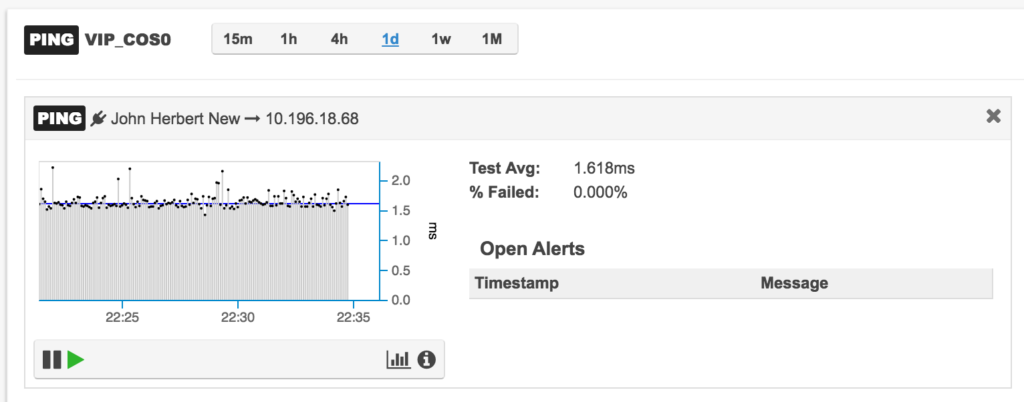
Now looking back to the left of the screen where the aggregate chart used to be, it’s now a detailed graph of data from just my agent:
The chart shows around the last 15 minutes of results, and as new results come in, the chart is dynamically updated. Beneath the chart is a toolbar, on the left hand side of which are pause and play icons. For the longest time, I was convinced that this would in some way animate the chart, or play back history, or something. Actually, it’s a way to pause and restart the actual testing. I’m not sure thats entirely intuitive, especially in the absence of any hover text to indicate otherwise. Right at the top there is a time period selection list. Contrary to my expectations, choosing a time value here does not change the chart; instead it changes the statistics listed to the right of the chart (e.g. Test Avg, and % failed).
Clicking on the Information icon below the bottom right of the chart pops up a small window showing information about the test performed (e.g. interval, TOS, ping type etc.). Clicking on the mini-chart icon to the left of the Information button opens up to the real meat of the chart:
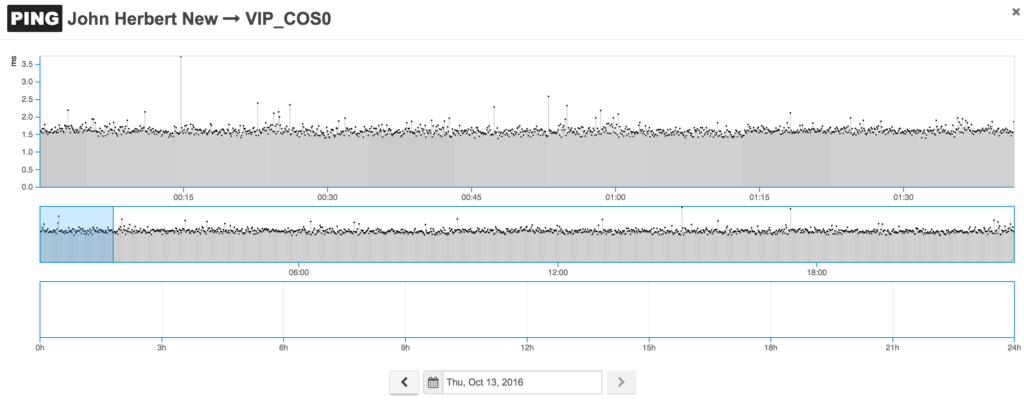
This is more like it. The top chart shows the response time charted for whatever time period has been selected by the blue area in the second chart, which itself represents a 24hour period. Below that is, is, well, I don’t know; it’s not labeled, but I’m assuming that the bottom chart tracks alerts over the 24 hour period. It’s easy to click and drag on the middle chart to select a time period, and data is fetched and drawn quickly. A different day’s data can be selected using the date selector at the bottom, and data can be exported as CSV from this screen as well.
If you want to examine the chart data as it crosses the midnight boundary, as far as I can tell, you’re out of luck. The chart is fixed on a 24h period from midnight to midnight, so you’ll just have to flick between days a lot. The ability to slide the timebase around is therefore another potentially useful feature that could be added.
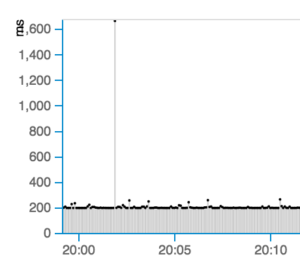
Trying to use this in anger, another frustration I found was that one bad ping would throw off the scale for the entire chart. For example:
In the example above, one ping took 1600ms rather than the usual 200ms, so the vertical scale is automatically adjusted to fit the spike in. However, I found that especially when there is a large difference in ping response time, the scaling can make the regular pings look like a line along the axis while the high ping stands out above it. This would be ok if there were some way to manually zoom in on the data so I could focus on what was happening with, say, some ~10ms pings rather than the 2600ms ping that’s in the same window.
Something else I found that I wanted to do at times was to bring up multiple resource charts for an agent at the same time so that I could compare them. This is possible to do using the Reports menu, but doing so means dropping down to 1h interval data, so all the resolution is gone at that point. Reporting also means that the chart shows response times from all agents assigned to run that Target test set by default, but that can be fixed.
In fact, these multi-agent charts are pretty neat:
In this case, by having the response times from agents around the country all plotted together, it’s easy to see that the response time to a particular monitored website was bad around 12PM on September 29th, and since all the agents detected the same increase in latency it’s pretty reasonable to assume that this is something to do with the website, rather than one particular ISP or location. Hovering over a name on the right hand side highlights that agent’s line on the chart, and clicking on any agent removes it from all charts within that Target test set, so if you want a single agent’s charts, you can deselect all the others. This is fine unless you have a lot of agents, at which point a deselect all
might be a nice option to have!
Traceroutes
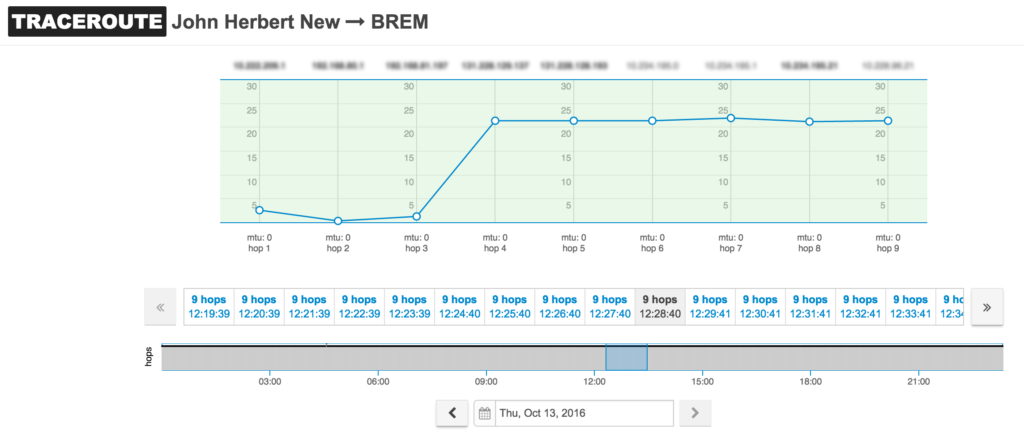
I mentioned earlier that I like the traceroute monitoring:
I have blurred the IP addresses to protect the innocent in the image above. As with the ping charts, it’s easy to select a time period, and the traceroute chart uses the same 24h view. The issue I found operationally is that when there is a change in the traceroute path, I need to be able to see two traceroutes side by side so that I can see exactly where the paths diverged. I do not believe that is currently possible, which is a great shame. I ended up having to write down the hops from one chart, then copy down the addresses on the second chart, and figure it out from there. Yes, I am like a fish when it comes to remembering sequences of IP addresses like that! Just keep pinging, just keep pinging, pinging, pinging… This one little operational challenge ends up reducing the helpfulness of a really useful feature when there is a crisis and every second counts. I still love the traceroutes though; they’re just so useful to have available.
Alerting
NetBeez alerting is pretty simple, but effective. Alerts appear in the management console and can be emailed – per Target test set – to selected addresses as well.
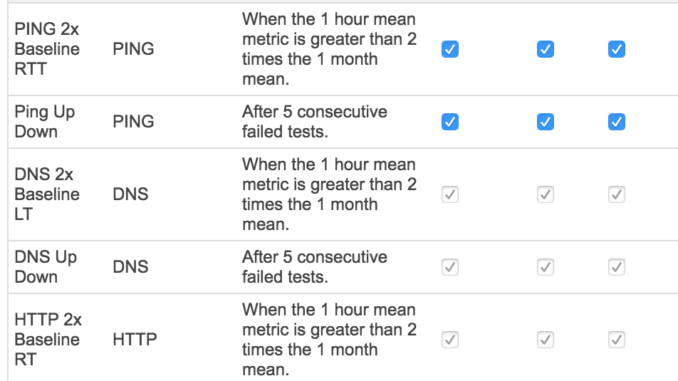
Alert triggers are configured globally by the administrator, and it looks like where other options are created, they will appear as options to select with a checkbox. In this case, only the default alert triggers are shown. I can’t test that currently, as our user level was reduced one at my request in order to ensure privacy in the NFD12 shared dashboard where we would otherwise all have access to each other’s agents. Sorry! 🙂
I have found the email alerts quite helpful in notifying me of a problem (given that I do not sit watching the management server in my browser all day), but NetBeez also integrates with Slack, PagerDuty and Splunk, and can generate SNMP, SMTP and syslog alerts.
Success Story
I got an alert early one morning that the latency to a number of destinations had increased, worded something like this:
Digging in, I discovered that the WAN team was installing a new backup link (with higher latency), and had failed all traffic over to test it. Once traffic failed back, I noted that the latency was still 10ms higher than it was before the change (a 50% increase from a 20ms baseline in this case). After some thought, the WAN engineer tweaked some metrics and like magic, the latency dropped back to 20ms where it was before. If I had not had the NetBeez agent running, I would never have known about the failover, and in turn I would have been unable to spot that our site’s latency had increased by 50% post-change. I’ll call that a win for NetBeez, then! I was able to check the traceroutes and see the new path that traffic traversed after the failover, and could even see the path change made to restore the lower WAN latency after I complained. That kind of visibility is gold when you need to point a finger.
Conclusions
There are many more things I could talk about that I know I’ve missed; there’s a lot of detail in this product and it’s hard to cover it all. Over all, I still like NetBeez. Now that I’ve had the chance to try and troubleshoot real problems with it, I’ve certainly found a few areas where, perhaps, the data is in the system but getting it on screen in an optimal way has been a challenge. That’s something I hope that can be addressed as the product develops (or in some cases, that perhaps I just missed the feature being there already!) The web interface is clean and attractive, though it sometimes leaves me guessing what something does, and my previous complaints about the terminology (e.g. Targets) are still valid 18 months on, which suggests I’m perhaps in a minority on this one.
Given that I first used a Beez 18 months ago, one obvious question is to ask how much the product has developed between now and then. The answer is fairly simple: it has improved, and the updates have been delivered without incident. I would suggest that from a user perspective, however, that I had hoped for even more movement in the capabilities and reporting/troubleshooting abilities offered. There may have been huge efforts made improving things under the hood,
but I would l have liked to have seen a more dramatic difference over a year and a half.
With all of that said, I’d still keep NetBeez in the product to watch
category. The pricing model seems pretty reasonable, the agents are small and easy to deploy, and they certainly can give you visibility into the network from multiple locations, which can really help in identifying where a problem occurred. I’m sure that the team will keep enhancing the product, and as they do so, NetBeez inevitably becomes a progressively more attractive option. If I am lucky enough to see NetBeez in another 18 months, I fully expect to be blown away. The gauntlet has been dropped, sirs!
Links
To get another perspective about NetBeez, why not check out fellow NFD12 delegate Tim Miller who wrote about them in his article Seeing the Network Through Your User’s Eyes.
Tech Field Day records all the vendor presentations in high definition then makes them available to stream on demand via Vimeo and YouTube. If you are curious to learn more about the NetBeez solution, it’s worth hearing the story from the horse’s mouth, as it were, and watching the presentations for yourself. There were four topics covered, with links to each video below:
- NetBeez Typical Customer Installation
- NetBeez Live Demonstration with Stefano Gridelli
- NetBeez Architecture and Features
- NetBeez and Distributed Network Monitoring
Disclosure
I was an invited delegate to Network Field Day 12, at which NetBeez presented. Sponsors pay to present to NFD delegates, and in turn that money funds my transport, accommodation and nutritional needs while I am there. That said, I don’t get paid anything to be there, and I’m under no obligation to write so much as a single tweet about any of the presenting companies, let alone write anything nice about them. If I have written about a sponsoring company, you can rest assured that I’m saying what I want to say and I’m writing it because I want to, not because I have to. NetBeez gave me a Beez FastEthernet agent and access to a shared online management portal.
You can read more here if you would like.




Thanks for this and the last blog John, really useful insight to the product dev